Visualizing Information: Concepts for Illustrators

Sessions College Illustration Department Head Russell Chun is developing a course that’s close to his heart. Russell’s Technical Illustration and Infographics course is a key piece in the new Associate of Occupational Studies in Illustration program, part of Sessions College’s expanding suite of online degree programs for design students.
How will the course unlock the talents of illustration majors? Course Producer Catherine Slye interviewed Russell to find out the philosophy behind the course.
Q: Your background in medical and textbook illustration and journalism seems to be the perfect crossroads of art and information. Describe your goals in creating the Technical Illustration and Infographics course.
In my course, I hope to advance both the conceptual and the technical aspects of information design. I want students to learn about the theoretical work that has already been done, as well get their hands dirty grappling with actual data and realistic infographic projects. An important part of the course is to critically evaluate professional infographic work. Students need to be able to identify the factors that make any instructional graphic successful and incorporate those factors in their own designs.
The course naturally progresses from the basic to the more complex. It begins with an introduction to the multi-disciplinary field, and I define the work and growing importance of technical illustration and infographics.
The course then proceeds with data visualization, where students learn to create graphs that translate numbers into visual properties. Students learn about visual hierarchies and how best to handle representation, when and where realism is more appropriate or effective than abstract iconography.
We tackle ways of showing complex structures, and focus on ways of showing complex processes. Students learn to weave a strong narrative within their design.
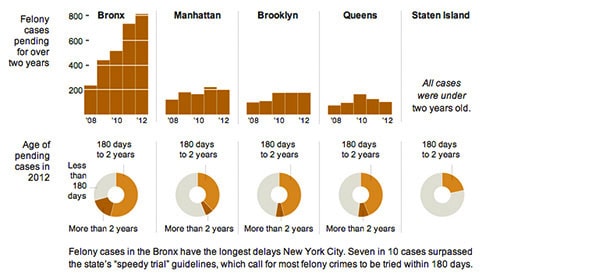
Image Credit: “Faltering Courts, Mired in Delays” (New York Times)
Q: Your undergraduate degree is in biology, but you’ve written numerous books on software technology. Your experiences cross over science, technology, and art, which is impressive and very intriguing. Can you share a personal story about how these diverse topics converge for you?
Those disciplines naturally converged for me. My driving interest is in both science and art, and technology is simply the tool. Although they may appear to be diverse topics, science, technology, and art have always been under a larger umbrella of visual communication for me.
I began my career as a medical illustrator, but quickly moved into doing animations and interactive media for biology and the sciences, more broadly. In my position, we taught our freelancers how to use our animation software, and I enjoyed the experience. That led me down the path of teaching, which I do now at Sessions College and at the City University of New York Graduate School of Journalism, where I teach data visualization.
Teaching, at one level, is essentially the communication of complex information, and I think infographic designers who can think like teachers are more attuned to the content and the needs of their readers.
Q: In your course you talk about how infographic designers must always keep the end goals of the user at the forefront of their mind. Is this is a key concept for you?
Successful infographic designers anticipate how readers respond to the content and presentation, and they provide visual solutions for them. Identifying your audience, therefore, is one of the first steps in crafting an infographic.
Another core concept in information design is to always think about and show comparisons. Infographics don’t just reveal the information or data; they make comparisons that put the information in context.
Another core concept is more of a mantra: clarify, don’t simplify.
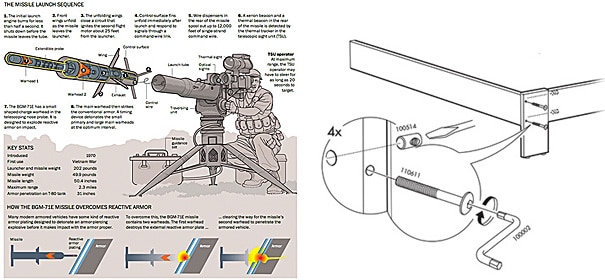
Image credit: The Washington Post (L) and Ikea (R)
Q: Infographic design is part of the larger field of technical illustration, but technical illustration involves a lot more than infographics. What’s your vision for how the two inform each other?
The terminology can be confusing, and I find that many of the descriptions are fluid and evolving. There are many terms that describe similar efforts, but the end goal of all of them is identical, which is to create graphics that effectively communicate complex information.
Infographics is a term that tends to be used for graphics that target broader, more generalized audiences such as readers of newspaper graphics. Technical illustration implies graphics for a narrower field, such as mechanical, architectural, or scientific illustration.
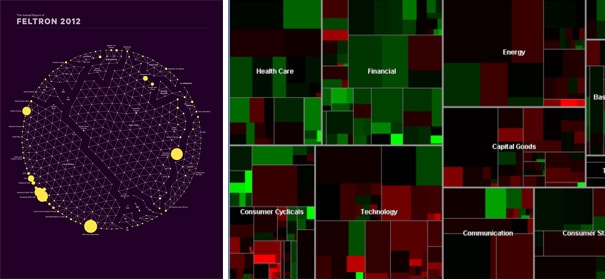
Image credit: Nicholas Felton (L) and Martin Wattenberg (R).
Q: You refer to Edward Tufte’s research and work quite a bit: clearly you are a fan! Are other up-and-coming designers advancing the art of data representation, infographic design, and technical illustration?
Edward Tufte isn’t a designer, but he is a giant in the field because of his influential ideas and principles of information design that he so rigorously lays out. I consider him the natural starting point for any infographics designer.
There are so many creative folks doing outstanding and inspiring work in data visualization and infographics design! Just some of the designers and design firms whose work I admire (in no particular order) include Nicholas Felton, Jonathan Harris, Fernanda Viegas and Martin Wattenberg, Stamen Design, Periscopic, Pitch Interactive, David Goodsell, XVIVO, and the graphics teams at the New York Times and the Guardian.
Visit sessions.edu for more information on Degree Programs and Undergraduate Certificates at Sessions College. Make sure you request our latest catalog and check out Degree and Undergraduate Certificate admissions.

Sessions Staff is a restless soul who loves to share Campus News stories with current and prospective students.